37: Variance Chart: Raw Data, Distribution, Differences
Variance Chart
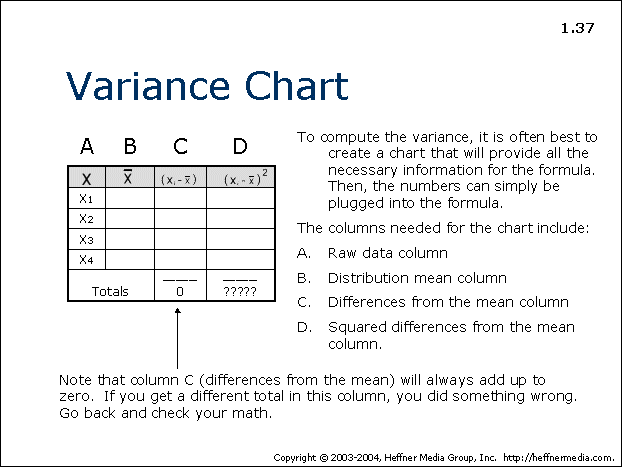
To compute the variance, it is often best to create a chart that will provide all the necessary information for the formula. Then, the numbers can simply be plugged into the formula.
The columns needed for the chart include:
A. Raw data column
B. Distribution mean column
C. Differences from the mean column
D. Squared differences from the mean column
Note that column C (differences from the mean) will always add up to zero. If you get a different total in this column, you did something wrong. Go back and check you math.
