Skip to content

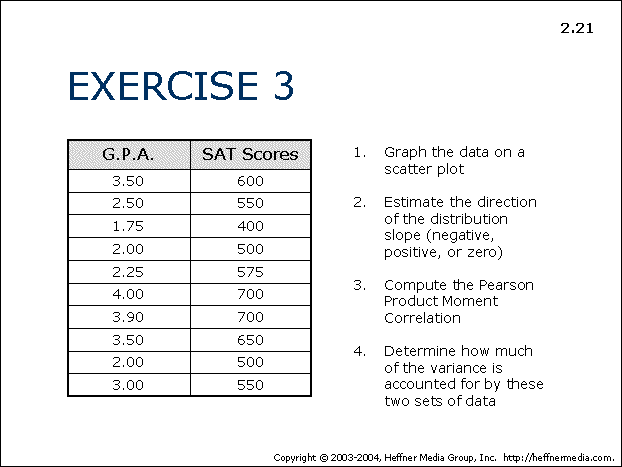
EXERCISE 3
- Graph the data on a scatter plot
- Estimate the direction of the distribution slope (negative, positive, or zero)
- Compute the Pearson Product Moment Correlation
- Determine how much of the variance is accounted for by these two sets of data