Chapter 2.4: Analyzing Research Results
What do all those Numbers Mean?
Unlike the often times subjective nature of psychology, research is a means to objectively measure psychological phenomenon. Research uses statistical measures to determine likelihood, probability, and relationships, and therefore, when reading a research paper you will often come across statistics that help you understand the results. Lets look at some of the statistics commonly used in psychological research, especially those related to the study of personality.
Averages
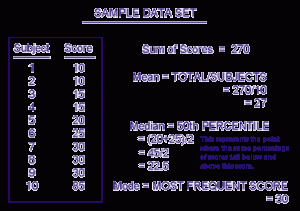
One of the simplest measures in a research study is that of average and variance. There are three types of averages: mean, median, and mode. The one most of us are aware of is mean, referring to the total of the subjects scores divided by the total number of subjects. The median, simply enough, is the score that falls at exactly the 50th percentile, or the mathematical middle. Finally, the mode refers to the score that occurs most often. Groups of scores that have more than one mode are considered bimodal. See the sample data set below.
As you can see by the statistics above, the mean, median, and mode are not always the same. When all three are the same, the data set is said to be normally distributed. In other words, the mean, mode, and median all fall at the 50th percentile so there are an equal number of scores on either side. A good example of this is the intelligence quotient (IQ) which has a mean, median, and mode of 100 and 50% of scores fall above and 50% fall below this number.
Statistical Significance
Before you can understand statistical significance, you must first understand the role chance plays in any data set. If you flip a coin 100 times, for example, you would guess that 50% of the time the outcome would be heads, and 50% tails. The truth is, however, that you may actually get 47% heads and 53% tails, or perhaps even 60% heads and 40% tails. Does these mean the coin is flawed? No, it just means that chance dictates that you will average 50/50 or somewhere close to that.
But what if we flipped this same coin 100 times and got 18 heads and 82 tails? What if we did it again and got 21 heads and 79 tails? Could we then say that there is something wrong with this coin? If we continue to see a pattern such as this that seems so far fetched, so different from each other, we could say that these coin toss results are statistically significant. In other words, the results are so different that they could not have been caused merely by chance.
When we perform a statistical significance test on a data set, we are looking to determine how much of a difference in scores could be caused by chance and how much could be caused by what we are trying to measure. Researchers agree that if the odds are less than 5% (or 1% depending on the type of study and the researcher’s goals) that chance caused the difference then the difference is said to be significant. If they show that chance played a role greater than 5%, the results are considered not significant.
Correlation
We talked about the research technique known as correlation earlier, but we didn’t discuss how the correlation is determined. If you recall, a correlation represents a relationship between two variables and does not show cause and effect. This relationship is determined by a statistical analysis of the data that derives a correlation score ranging from +1.00 to -1.00.
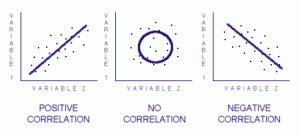
A positive correlation, one that shows both sets of data moving in the same direction, is one that is greater than zero. The closer to +1.00 you get, the stronger the relationship. A negative correlation, where the two data sets respond in opposite directions, results in a correlation of less than zero. Again, the closer you get to -1.00, the stronger the relationship. A correlation of zero (or close to it) represents no relationship between the two data sets. If we were to graph the results of a correlation, the results may look something like the diagram below. Notice how a shape of the plotted data points emerges.

