45: Eexercise 2: Construct, Graph, and Determine
EXERCISE 2
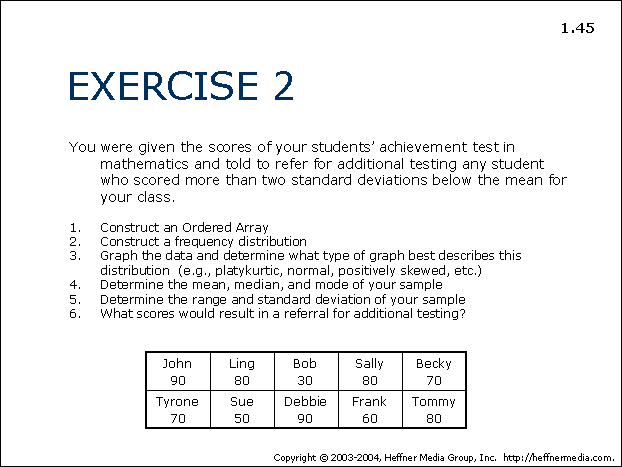
You were given the scores of your students’ achievement test in mathematics and told to refer for additional testing any student who scored more than two standard deviations below the mean for your class.
- Construct an Ordered Array
- Construct a frequency distribution
- Graph the data and determine what type of graph best describes this distribution (e.g., platykurtic, normal, positively skewed, etc.)
- Determine the mean, median, and mode of your sample
- Determine the range and standard deviation of your sample
- What scores would result in a referral for additional testing?
