Platykurtic Graph
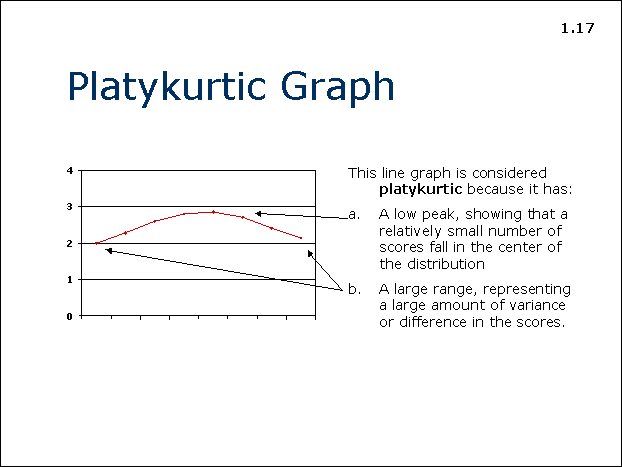
The line graph is considered platykurtic because it has:
a. A low peak, showing that a relatively small number of scores fall in the center of the distribution
b. A large range, representing a large amount of variance or difference in the scores.