15: Pearson r Chart: Data Chart
Pearson r Chart
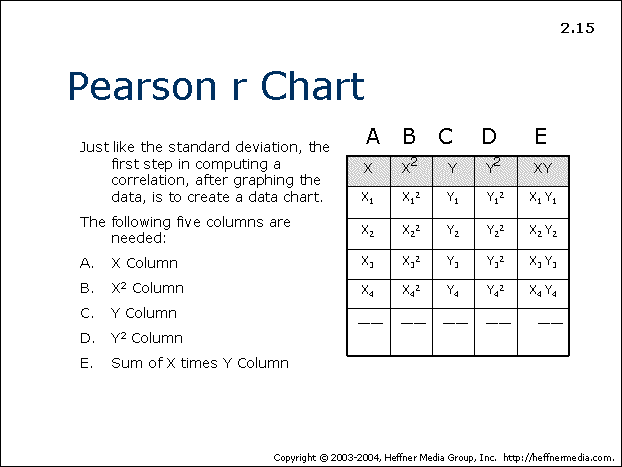
Just like the standard deviation, the first step in computing a correlation, after graphing the data, is to create a data chart.
The following five columns are needed:
-
- A. X Column
-
- B. X² Column
-
- C. Y Column
-
- D. Y² Column
-
- E. Sum of X times Y Column