Chapter 8.3 Types of Distributions
Types of Distributions

When datasets are graphed they form a picture that can aid in the interpretation of the information. The most commonly referred to type of distribution is called a normal distribution or normal curve and is often referred to as the bell shaped curve because it looks like a bell. A normal distribution is symmetrical, meaning the distribution and frequency of scores on the left side matches the distribution and frequency of scores on the right side.
The Normal Curve
Many distributions fall on a normal curve, especially when large samples of data are considered. These normal distributions include height, weight, IQ, SAT Scores, GRE and GMAT Scores, among many others. This is important to understand because if a distribution is normal, there are certain qualities that are consistent and help in quickly understanding the scores within the distribution
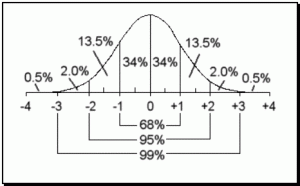
The mean, median, and mode of a normal distribution are identical and fall exactly in the center of the curve. This means that any score below the mean falls in the lower 50% of the distribution of scores and any score above the mean falls in the upper 50%. Also, the shape of the curve allows for a simple breakdown of sections. For instance, we know that 68% of the population fall between one and two standard deviations (See Measures of Variability Below) from the mean and that 95% of the population fall between two standard deviations from the mean. Figure 8.1 shows the percentage of scores that fall between each standard deviation.
IQ Score Distributions
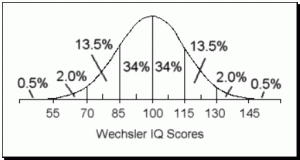
As an example, lets look at the normal curve associated with IQ Scores (see the figure above). The mean, median, and mode of a Wechsler’s IQ Score is 100, which means that 50% of IQs fall at 100 or below and 50% fall at 100 or above. Since 68% of scores on a normal curve fall within one standard deviation and since an IQ score has a standard deviation of 15, we know that 68% of IQs fall between 85 and 115. Comparing the estimated percentages on the normal curve with the IQ scores, you can determine the percentile rank of scores merely by looking at the normal curve. For example, a person who scores at 115 performed better than 87% of the population, meaning that a score of 115 falls at the 87th percentile. Add up the percentages below a score of 115 and you will see how this percentile rank was determined. See if you can find the percentile rank of a score of 70.
Skew
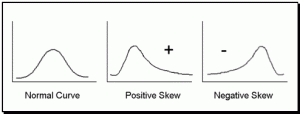
Skew. The skew of a distribution refers to how the curve leans. When a curve has extreme scores on the right hand side of the distribution, it is said to be positively skewed. In other words, when high numbers are added to an otherwise normal distribution, the curve gets pulled in an upward or positive direction. When the curve is pulled downward by extreme low scores, it is said to be negatively skewed. The more skewed a distribution is, the more difficult it is to interpret.
Kurtosis
Kurtosis. Kurtosis refers to the tails of a distribution. A normal distribution or normal curve is considered a perfect mesokurtic distribution. Curves that have more extreme tails than a normal curve are referred to as leptokurtic. Curves that have less extreme tails than a normal curve are said to be platykurtic.
Statistical procedures are designed specifically to be used with certain types of data, namely parametric and non-parametric. Parametric data consists of any data set that is of the ratio or interval type and which falls on a normally distributed curve. Non-parametric data consists of ordinal or ratio data that may or may not fall on a normal curve. When evaluating which statistic to use, it is important to keep this in mind. Using a parametric test (See Summary of Statistics in the Appendices) on non-parametric data can result in inaccurate results because of the difference in the quality of this data. Remember, in the ideal world, ratio, or at least interval data, is preferred and the tests designed for parametric data such as this tend to be the most powerful.


